
Overview
Understand your BMI chart with full body mass index ranges for adults, women, men, and children. Formula, worked examples, and health risks explained.
BMI Chart – Body Mass Index Ranges, Formula and Categories Explained
A BMI chart shows where your body mass index falls — underweight, normal, overweight, or obese. Body mass index (BMI) measures weight relative to height and serves as the world's most widely used weight screening tool. This BMI calculator body mass index guide gives you everything needed to read your result confidently. DigiCalc's BMI Calculator runs the numbers instantly — this guide explains what those numbers mean.
The sections below cover BMI charts for adults, women, men, and children, the full formula with worked examples, and health implications for every category. All ranges follow WHO and CDC guidelines.
What Is BMI (Body Mass Index)?
BMI, or Body Mass Index, is a number calculated from a person's weight and height. The World Health Organization defines BMI as weight in kilograms divided by height in metres squared (kg/m²). Health professionals worldwide use it as a low-cost screening tool to identify weight categories linked to health problems. BMI does not directly measure body fat. It correlates with body fat in most adults. Health professionals use it as a practical, low-cost screening method in clinical settings worldwide.
The BMI Formula – How to Calculate Your BMI
BMI uses one of two formulas depending on whether you measure in metric or imperial units.
Metric Formula
BMI = weight (kg) ÷ height (m)²
Example: A person weighing 75 kg at 1.75 m height: 75 ÷ (1.75 × 1.75) = 75 ÷ 3.0625 = 24.5 — Normal weight.
Imperial Formula
BMI = (weight (lbs) ÷ height (in)²) × 703
Example: A person weighing 165 lbs at 69 inches: (165 ÷ 4,761) × 703 = 0.03466 × 703 = 24.4 — also Normal weight.
Both formulas produce the same result. DigiCalc's BMI Calculator handles metric and imperial inputs automatically — no manual calculation needed.
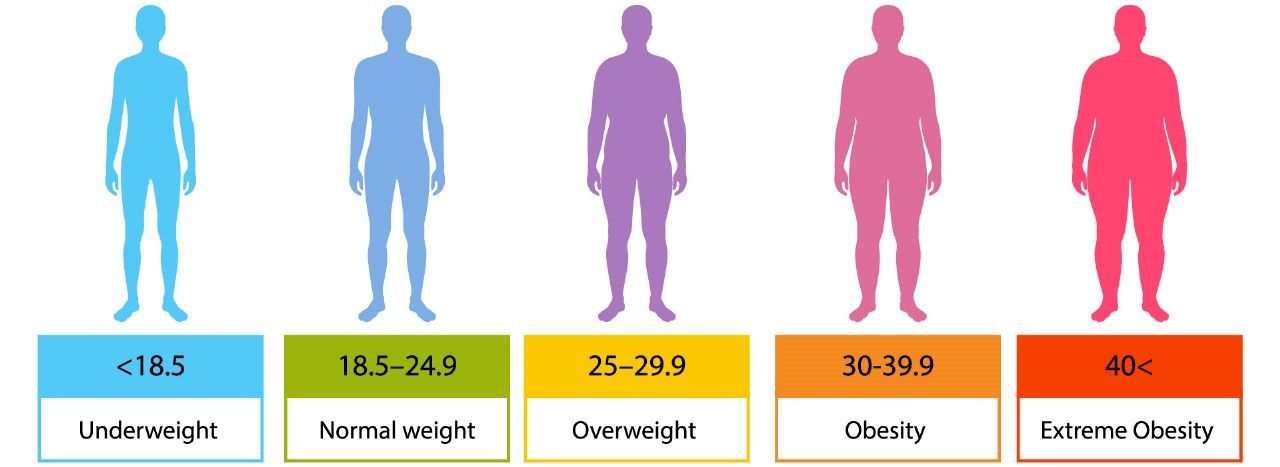
BMI Chart for Adults – All Ranges Explained
The table below shows the WHO's BMI classification for adults aged 18 and over.
| BMI Range | Category | Health Implication |
|---|---|---|
| Below 18.5 | Underweight | Risk of malnutrition, anaemia, osteoporosis |
| 18.5 – 24.9 | Normal weight | Lowest risk of weight-related disease |
| 25.0 – 29.9 | Overweight | Increased risk of type 2 diabetes, hypertension |
| 30.0 – 34.9 | Obese Class I | High risk — lifestyle changes recommended |
| 35.0 – 39.9 | Obese Class II | Very high risk — medical supervision advised |
| 40.0 and above | Obese Class III (Morbid) | Severely high risk — specialist intervention often needed |
The normal BMI range of 18.5 to 24.9 carries the lowest all-cause mortality risk in adults, according to WHO population data. Health authorities in the United States, United Kingdom, Canada, and Australia all apply the 25.0 overweight threshold and 30.0 obesity threshold consistently.
BMI Chart for Women – What Is a Normal BMI?
The WHO BMI chart applies the same ranges to men and women — normal weight runs from 18.5 to 24.9 for both sexes. Women, however, naturally carry higher body fat percentages than men at the same BMI value, due to hormonal and physiological differences.
Both sit in the normal weight category at BMI 22. Yet the woman typically carries a higher proportion of body fat. BMI cannot distinguish between fat mass and lean mass. BMI cannot distinguish between fat mass and lean mass — a key limitation.
For women specifically:
- A BMI below 18.5 can indicate low bone density and hormonal disruption alongside underweight risk.
- A BMI between 18.5 and 24.9 represents the target healthy range from both the WHO and NHS.
- A BMI above 30 raises the risk of breast cancer, polycystic ovary syndrome (PCOS), and gestational diabetes during pregnancy.
For a more precise measure, DigiCalc's Body Fat Calculator estimates actual body fat percentage — more informative for women focused on body composition.
BMI Chart for Men – Understanding Your Result
Men follow the same standard BMI ranges. The key difference: men carry more lean muscle mass than women. A muscular man may land in the overweight range (25–29.9). He can still maintain a healthy or even low body fat percentage.
Two contrasting examples:
- A male professional rugby player at 100 kg and 1.80 m has a BMI of 30.9. On paper, that is Obese Class I. Yet he may carry very low body fat and excellent cardiovascular health.
- A sedentary male office worker at 85 kg and 1.75 m has a BMI of 27.8 — Overweight. He may carry excess visceral fat despite a moderate-looking number.
BMI is a screening number, not a diagnosis. Men who strength train should pair their BMI with waist circumference for a more complete picture.
BMI Chart for Children and Teenagers (Ages 2–20)
Child and adolescent BMI (ages 2 to 20) works differently from adult BMI. Children's results use age- and sex-specific percentiles from the CDC growth charts rather than fixed numeric thresholds.
| Percentile Range | Category |
|---|---|
| Below 5th percentile | Underweight |
| 5th to less than 85th percentile | Healthy weight |
| 85th to less than 95th percentile | Overweight |
| 95th percentile and above | Obese |
Children's bodies change rapidly during growth, so a BMI of 18.0 means something entirely different for a 5-year-old versus a 16-year-old. The CDC and American Academy of Pediatrics (AAP) recommend a paediatrician review all child BMI results rather than applying adult chart thresholds.
Health Risks of a High BMI – Overweight and Obesity
The World Health Organization reports that over 1 billion people worldwide lived with obesity in 2022. A BMI above 25 raises the risk of several chronic conditions significantly:
- Type 2 diabetes: NIH data shows people with BMI above 30 face 7 times greater risk of developing type 2 diabetes. That compares to those with a normal BMI.
- Cardiovascular disease: Excess body fat raises blood pressure, LDL cholesterol, and inflammation — three major contributors to heart attack and stroke.
- Sleep apnoea: Fatty tissue around the neck narrows airways and causes breathing interruptions during sleep. This condition becomes more common above BMI 30.
- Certain cancers: The International Agency for Research on Cancer (IARC) links obesity to 13 cancer types, including colon, breast, and liver cancer.
- Joint problems: Each extra kilogram of body weight adds roughly 4 kg of force on the knee joints, accelerating osteoarthritis development over time.
The American Heart Association notes that a sustained 5–10% BMI reduction can lower cardiovascular risk, blood glucose levels, and sleep apnoea severity.
Health Risks of a Low BMI – Underweight
A BMI below 18.5 signals underweight status and carries health risks that often go unrecognised:
- Malnutrition and nutrient deficiency: Low body weight typically reflects insufficient intake of vitamins, minerals, and protein.
- Bone density loss: Underweight status raises the risk of osteoporosis, particularly in women. Very low body weight reduces oestrogen levels, which in turn lowers bone mineral density.
- Immune system impairment: The body needs adequate fat and protein stores to mount effective immune responses. Chronic underweight raises susceptibility to infection.
- Fertility issues: In women, a BMI below 18.5 can disrupt menstrual cycles and reduce fertility through hormonal changes linked to low body fat.
A BMI below 18.5 warrants a healthcare provider consultation to rule out thyroid disorders, gastrointestinal conditions, or eating disorders.
BMI vs Body Fat Percentage – Which Is More Accurate?
BMI serves as a quick screening tool. Body fat percentage gives a more direct measure of body composition. Here is how the two compare:
| Measurement | What It Measures | Accuracy | How to Get It |
|---|---|---|---|
| BMI | Weight relative to height | Moderate — misses muscle vs fat split | Free — just weight and height needed |
| Body Fat % | Actual fat mass as % of total body weight | High — directly measures what matters | Skinfold calipers, DEXA, or bioimpedance scale |
BMI works well as a free, fast starting point for most people. Athletes, bodybuilders, and anyone focused on body composition rather than raw weight should calculate body fat percentage for a more complete picture.
Limitations of BMI – What the Chart Does Not Tell You
BMI works well at the population level, but the WHO itself acknowledges several limitations at the individual level:
- Muscle and fat look identical. At BMI 28, a lean athlete with 10% body fat receives the same "overweight" label as a sedentary person with 30% body fat. BMI cannot distinguish between them. BMI cannot distinguish between them.
- Fat location goes unmeasured. Visceral fat around the abdominal organs carries more health risk than subcutaneous fat beneath the skin. Two people at the same BMI can have very different risk profiles based on fat distribution.
- Age and bone density matter. Older adults tend to hold less muscle and more fat at the same BMI as younger adults. Denser bones in younger adults add weight without health risk.
- Ethnicity cutoffs differ. People of Asian descent face elevated health risks at lower BMI values than populations of European descent. The WHO has proposed adjusted thresholds of 23.0 for overweight and 27.5 for obesity in Asian populations.
- Pregnancy invalidates BMI. BMI does not apply during pregnancy. Gestational weight gain guidelines from the Institute of Medicine (IOM) replace it.
Treat BMI as one input, not a final verdict. Pair it with your Basal Metabolic Rate (BMR) and waist circumference for a more complete health assessment.
How to Use DigiCalc's BMI Calculator
DigiCalc's BMI Calculator uses the same WHO-approved formula that clinicians apply worldwide. Follow these steps:
- Enter your weight in kilograms or pounds.
- Enter your height in centimetres, metres, feet, or inches.
- Click Calculate — your BMI and category appear instantly.
- Compare your result with the BMI chart above to understand what it means for your health.
No account or signup required. Try the BMI Calculator now.
Tips to Move Toward a Healthy BMI
If your BMI sits outside the 18.5–24.9 range, these evidence-based strategies can help move it toward a healthier level:
- Prioritise protein at every meal. A high-protein diet of 1.2–1.6 g per kg of body weight reduces appetite and preserves muscle mass during weight loss. This makes BMI reduction more sustainable over time.
- Track energy balance, not just food quality. BMI shifts when caloric intake falls below your Total Daily Energy Expenditure (weight loss) or rises above it (weight gain). DigiCalc's BMR Calculator gives you your baseline calorie need.
- Add resistance training alongside cardio. Cardio burns calories. Resistance training builds muscle and raises resting metabolic rate, making long-term BMI management easier.
- Cut ultra-processed food intake. Research in the British Medical Journal shows ultra-processed food diets raise caloric intake by 500 kcal/day versus unprocessed diets. That directly drives BMI upward.
- Prioritise sleep quality. Sleeping under 6 hours per night disrupts ghrelin and leptin — hunger-and-fullness hormones — raising the likelihood of overeating and weight gain.
Based on guidelines from the World Health Organization, Centers for Disease Control and Prevention, and National Institutes of Health.